lab
This procedure is part of a lab that teaches you how to get started with New Relic to monitor your application.
Each procedure in the lab builds upon the last, so make sure you'v instrumented your application with our APM and browser agents, before starting this one.
With your app reporting data to New Relic, you now have insights into your app.But you want to understand the collected data better. For example, you want to know how many users are active on your site. For that, you explore your data using NRQL, New Relic's query language; gather it; and visualize it in interactive charts.
In this procedure, you explore your data in New Relic. Specifically, you:
- View your page views
- Count active sessions
- View your transactions
- Count total transactions
- View your slowest transactions
- Count your transactions with different response codes
Query your data
Use NRQL to explore and retrieve detailed New Relic data and get insights into your application.
Tip
NRQL is New Relic's SQL-like query language. Read our documentation to know more about what it is and when to use it.
View your pageviews
Navigate to New Relic and sign in with your account. From the left navigation bar, click Query builder.
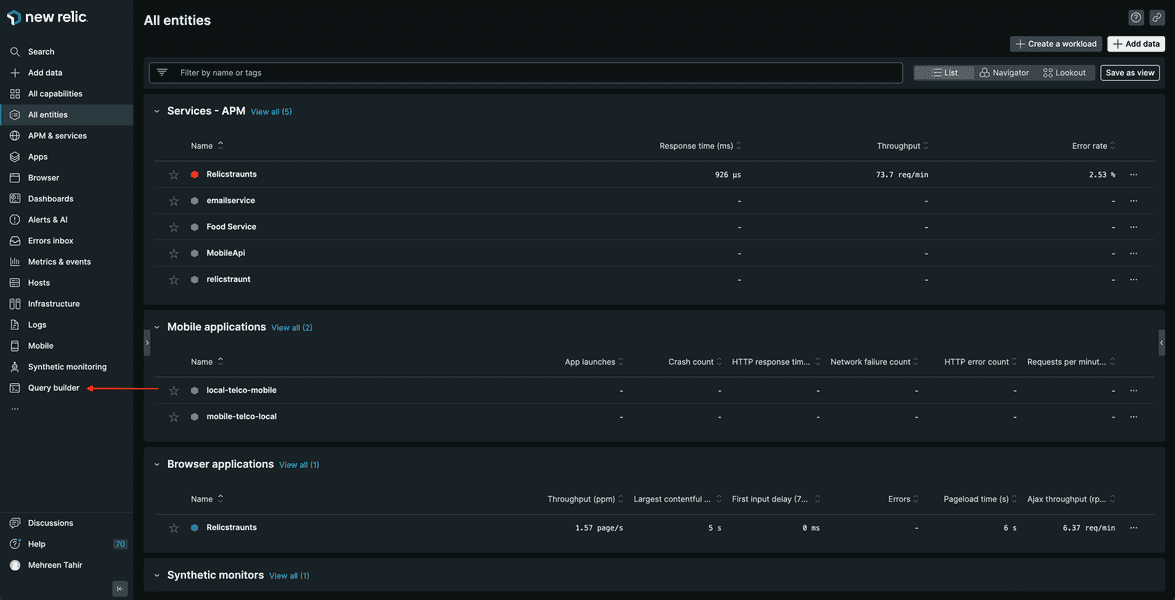
This opens an interactive Query builder to explore your data.
Here, execute the following query to view PageView records for your app.
SELECT * FROM PageView WHERE appName='Relicstraunts'Click Run to see results.
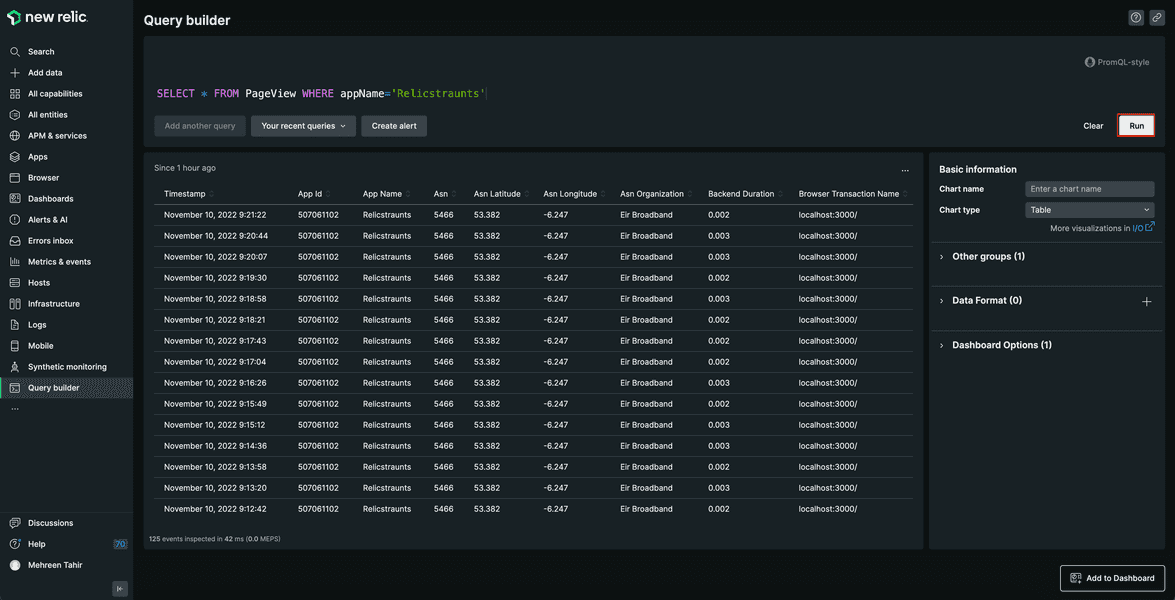
Here, you observe all the pageviews for your app.
Count active sessions
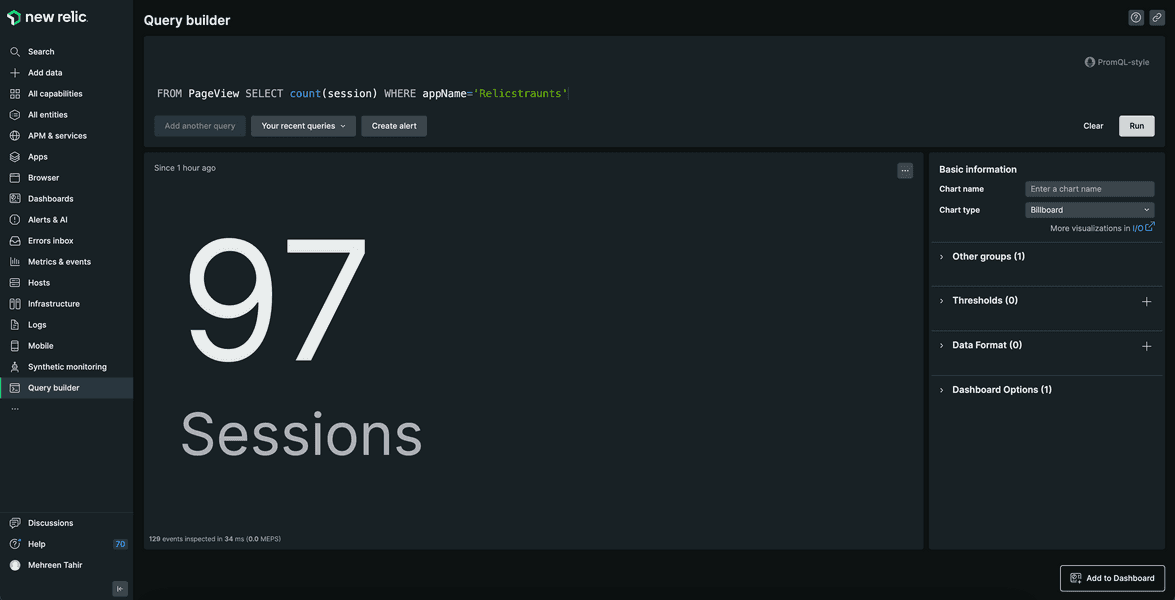
Use the following query to count your active sessions.
FROM PageView SELECT count(session) WHERE appName='Relicstraunts'Here, you see the number of active sessions.
View your transactions
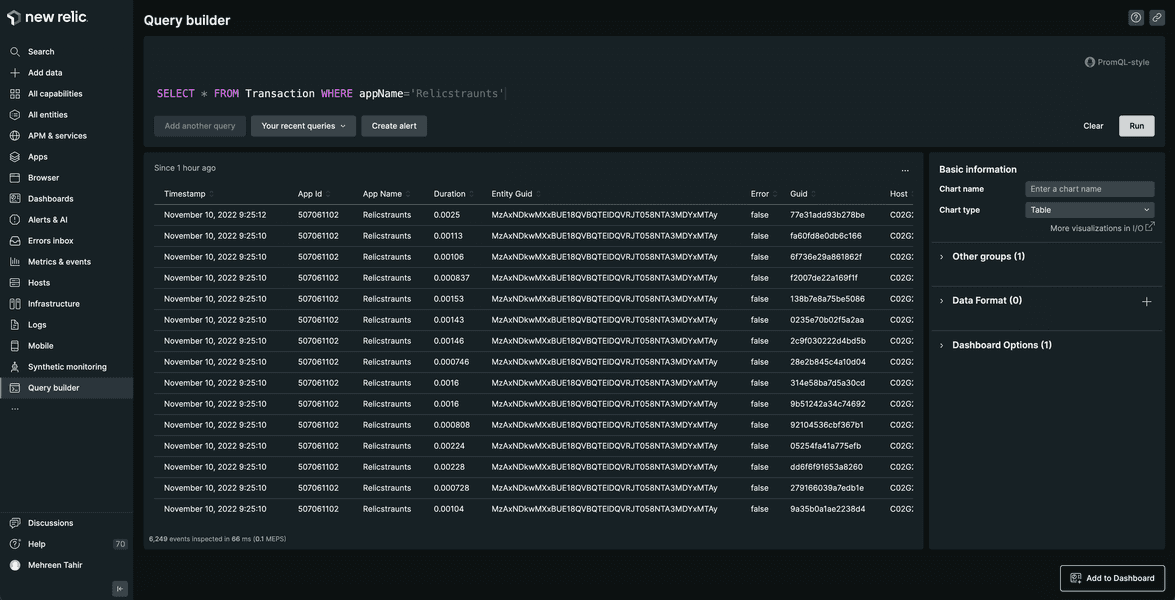
Use the following query to view all your transactions.
SELECT * FROM Transaction WHERE appName='Relicstraunts'Here, you see all your transactions for Relicstraunts app.
Count total transactions
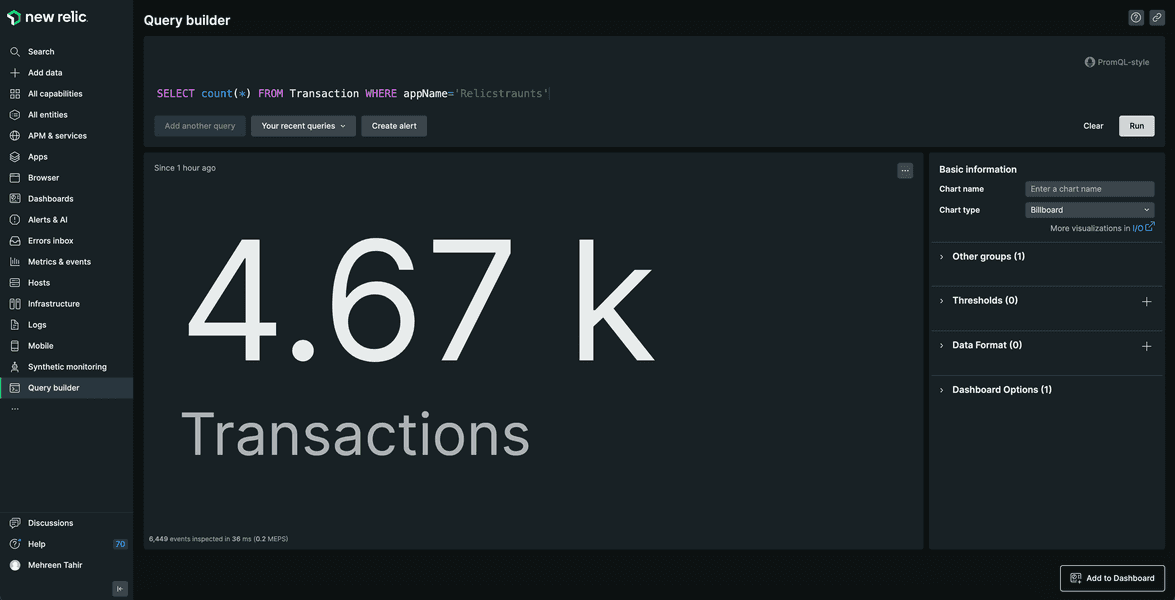
Use the following query to count your total transactions.
SELECT count(*) FROM Transaction WHERE appName='Relicstraunts'Here, you see the total number of transactions for your Relicstraunts app.
View slowest transactions
Execute the following query to view your slowest transactions.
SELECT max(duration) FROM Transaction Where appName='Relicstraunts' FACET nameHere, you see your slowest transactions.
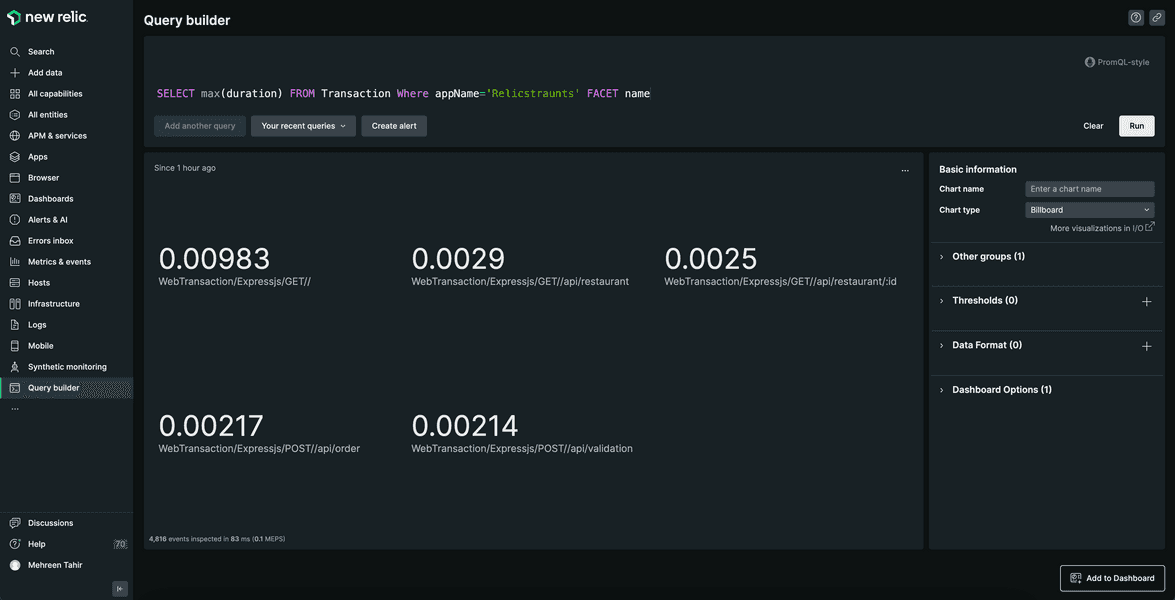
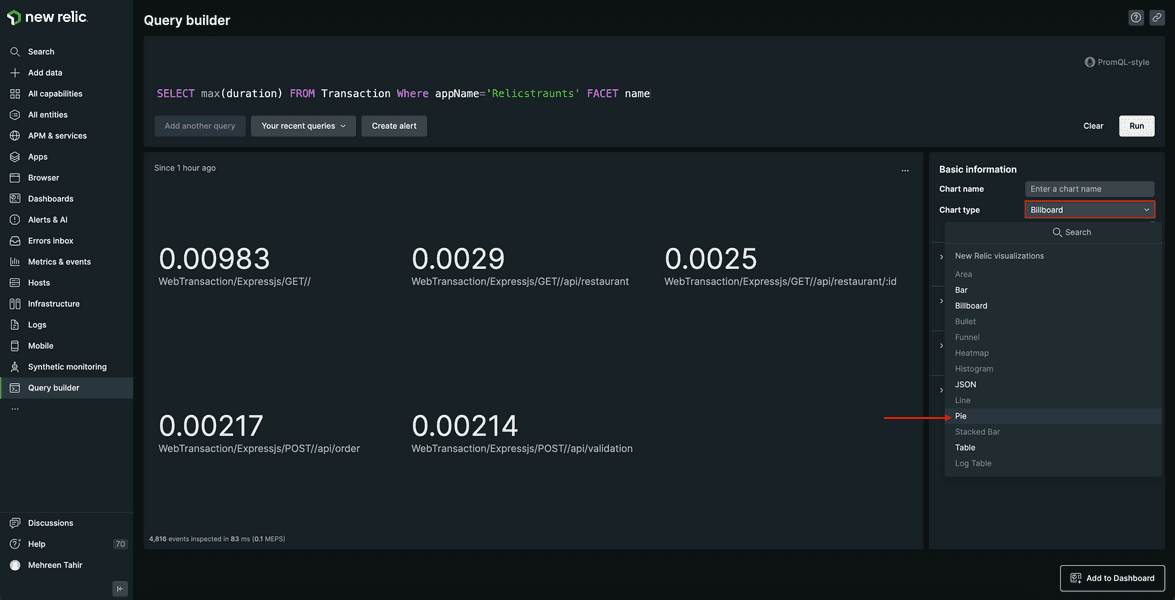
The chart is hard to see in this format. You can choose to present your results in different formats such as bar, table, or pie chart.
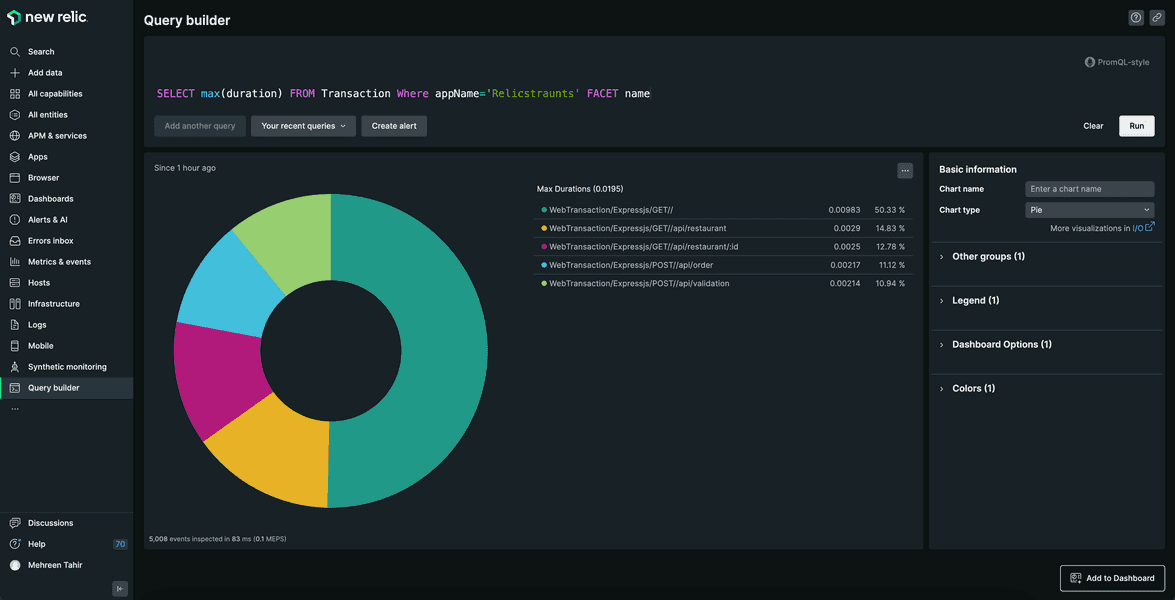
Change the chart type to Pie.
Now, you see your slowest transaction in the form of a pie chart.
Count your transactions with different response codes
Use the following query to view all your transactions with different response codes.
SELECT count(*) FROM Transaction WHERE appName='Relicstraunts' AND http.statusCode!='200' FACET http.statusCode
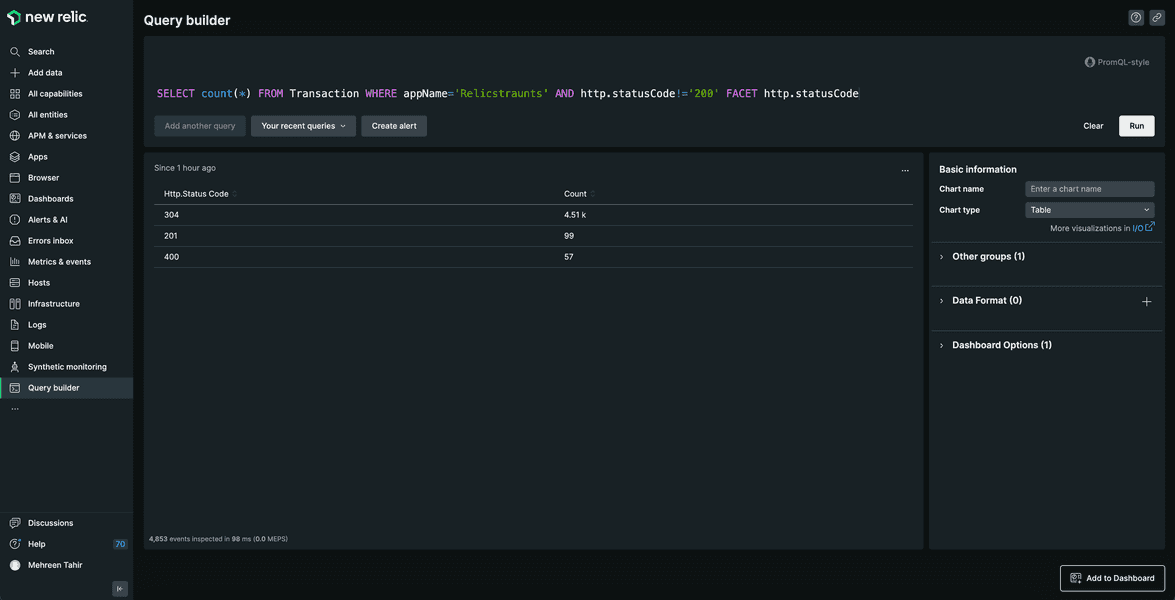
You've now seen your application's performance data. Next, you collect custom business data from your application with New Relic.
callout.lab
This procedure is part of a lab that teaches you how to get started with New Relic to monitor your application. Now that you've explored your application's performance related data, collect custom business data from your application.